
Article about IT Architecture Diagrams. Why, when and how to deal with them. How to create diagrams from text. Tools for writing architectural diagrams.
Being engaged in IT Architecture, you certainly deal with documenting the architecture. Looking ahead, I notice that in this article I am not writing about the methodology, styles, and practices in the preparation of architectural documentation. Instead of this, I’d recommend a great book, “Documenting Software Architectures: Views and Beyond, Second Edition,” if the topic is interesting to you to invest some time into it.
I am focusing your attention on one aspect - diagrams. I will tell you a story about how to cook them (I mean diagrams) efficiently and skillfully so that you don’t waste time on “work for work”. Architects usually “draw shapes and lines” - it is thus that we are explained the role of IT architect in software development. Frankly speaking, this is hard to argue with. Indeed, architects prepare product roadmaps, flow diagrams, deployment diagrams, state diagrams, reference architects, etc.
More in detail about the role of IT Architects please go to my article using the link.
Diagrams, Do You Need Them?
Working with different teams on different products, I often catch myself thinking that it is not easy to create architectural “pictures” so that they are clear to stakeholders. But if they raise more questions than they answer, it means they are “unnecessary.” Here are some typical indicators:
What does this figure mean?
What does the different shape of the outline mean in the figures?
What does this line or arrow mean?
What type of communication/association is represented by this arrow or line?
What does this color mean?
Lack of connections between chart elements: are they isolated entities?
What do these abbreviations mean? (ambiguous / undocumented abbreviations)
If you document the architecture in such a way that the above questions do not arise in the readers, then we move on - the necessity for diagrams. Here, in practice, opinions are often divided into two opposing groups. The first is that you need to prepare as many architectural documents as possible, so to speak, just in case. Alternative opinion - no documentation is required, let’s leave it at that. By the way, such a situation is not only about IT architecture: business analysis documents, specifications, user manuals - all the same. Let’s go into details of this topic one by one.
Why Do We Prepare Architectural Diagrams?
Let’s start with the general overview. IT Architecture is roughly the partitioning of a whole into parts, with relations between these parts. The larger and more complex the system, the more critical the partitioning into pieces, and hence the architecture itself. Architecture is what makes the sets of these parts interact and work together successfully as a whole. Architectural documentation helps to:
make the right decisions by architects;
explain to developers how to implement such solutions;
tell the evidence and root cause of such decisions.
Merely creating an IT product architecture is not something self-sufficient. You should appropriately communicate it to those stakeholders who need it to turn it into a real product. The documentation “speaks” for the architect today. It is necessary so that the architect does not have to answer the same questions a hundred times. The documentation “speaks” for the architect tomorrow — when he or she will no longer work on this product.
Making an architecture without documentation is like doing business without advertising. Only you know what you are doing, no one else. Neither the company nor the product nor you need it!
When Do You Need To Work On Architectural Documentation? - Definitely Not After Development
Documentation is often interpreted in practice as “afterthought” — something people do because they have to do it. Something that needs to be done because “it’s okay.” Maybe a contract demands it. Perhaps a customer requires it. It might be required by internal policies or standards. This may all seem like the truth. I do not deny the fact that such reasons are justifiable. But I know for sure that with such a vision and attitude, you cannot count on success and high-quality documentation. Why should the architect spend time and energy just because the manager has a specific item called “architectural documentation” in the delivery checklist ?!
The best architects make the best architectural documentation, not because it’s “required,” but because they see that it’s essential for a particular case: creating a high-quality product and with as little “re-do” as possible.
The documentation helps an architect while the architecting is in progress, not after.
A Picture’s Worth A Thousand Words — It’s About Architectural Diagrams
So, we got a sense of the question why? you need to document the architecture and when? you need to do it. But what should be placed in this documentation, how to find a balance between quality and quantity? I remind you that our primary focus is on architectural diagrams.
“A Picture’S Worth A Thousand Words” — the same applies to architectural diagrams. I am convinced that an epicenter of any architectural document is diagrams. By creating architectural diagrams, we reflect the internal structure and behavior of the IT product. But unfortunately, very often, the result is a far cry from the desired state. Either these diagrams are too detailed and overloaded, or on the contrary - indistinct and irrelevant. Such “pictures” cause more questions than give answers. They don’t have a value at all - as a result, we waste time.
Even when we have managed to find a balance between quantity and quality, and the architect and team have created the diagrams that are really needed and relevant, we rarely keep such documentation updated according to product changes. Why is this happening? I see the following reasons:
developers are often not in favor of ideas to create and maintain technical documentation; they consider it a redundant, exhausting and time-consuming process, arguing that the source code is enough;
costs for documentation support are not budgeted;
high costs for documentation support;
product life cycle management processes do not include aspects for updating and synchronizing documentation (and not only architectural) by the product changes (functional and non-functional requirements).
Disclaimer: This list does not claim to be full, and at the same time, I admit that there are always exceptions.
7 Rules To Make Your Architectural Diagrams Much Better
Let’s summarise the preceding. I offer the following 7 rules of “well-cooked” diagrams:
Write documentation from the reader’s perspective (developers, testers, business analysts, IT engineers, IT managers, etc.).
Avoid unnecessary repetitions and duplication in diagrams.
Avoid ambiguity.
Use and follow accepted standards.
Record the rationale of a decision (versioning, binding to a road map of a product).
Keep the documentation up to date.
Review the documentation for suitability.
How Can You Prepare Architectural Diagrams Better, But In Less Time?
Now we have the answers to the question what? should be diagrams so that they are valuable for the team, for the stakeholders. It is time to move on to how you can improve the process of creating and, more importantly, updating architectural diagrams.
Having limited the context of the article to diagrams, I will now focus exclusively on how you can optimize the process of their creation.
The benefits of having architectural documentation, including architectural diagrams, should outweigh the cost of creating them. The cost of documentation is primarily a human cost. Therefore, I realize that appropriate tools in the production process can support us and reduce our efforts in diagrams creation and maintenance. How is this possible?
The tool can generate diagrams from information already present as a result of design and development project activities.
As the IT solution evolves, the correspondent architectural diagrams should simultaneously evolve. The updating of architectural artifacts can be a part of Continuous Integration and run at the stage of building and preparing product artifacts for delivery.
A text editor is enough to create some diagrams.
It is difficult to find a team that does not use a version control system to manage the source code. Many organizations no longer even separate documentation from the source code repositories, and that’s great (hello GitHub, Azure DevOps, etc.). It’s just as convenient to write *.md files next to the source code files. And diagrams are an integral part of most architectural documents. What is the reason to prepare architectural diagrams somewhere in another editor, save them somewhere, and then just insert the final exported version into the markdown-file of the documentation ?! It seems inconvenient and illogical to me. I want to “write” diagrams in text, i.e., in markdown. And I do it in such a way, and I recommend the same to everybody of you.
How To Create Diagrams From Text
I suppose that you, as an architect, have your favorite set of modeling languages (AML - Architecture Modeling Language) and diagram types. There is something to choose from, there are no problems here. Then the logical question arises: how now to replace (partially, not wholly) MS Visio and switch to the Markdown editor? The answer is simple — markdown-like scripting languages for generating diagrams, graphs, charts, etc. from a text description. And here, I assure you that for almost any type of diagram, you will find a solution that allows you to declaratively describe your future visualizations. All this is also available through the CLI (Client User Interface) and on all platforms.
How not to hint at the pain when you live in two worlds simultaneously (Windows and macOS), and you’re used to MS Visio. Well, experts, of course, will now say that there is already MS Visio Online. I agree here that it’s like a breath of fresh air, but still, I don’t get tired of waiting for Visio for macOS.
Tools For “Writing” Architectural Diagrams
Here are some tools that you can use to prepare the diagrams by writing code (all as we love).
Mermaid
Mermaid — is a syntax similar to Markdown where you can use text to describe and automatically generate diagrams. With Mermaid’s Markdown-inspired syntax, you can generate flow charts, UML diagrams, pie charts, Gantt charts, and more. Moreover, it is already integrated with a massive number of different services and platforms, such as GitHub, Azure DevOps, Atlassian products, and many others.
Sample 1 — UML Flowchart
graph LR
    A[Square Rect] -- Link text --> B((Circle))
    A --> C(Round Rect)
    B --> D{Rhombus}
    C --> D
Flowchart — Mermaid
Sample 2 — Git Graph (I use it quite often to prepare the process documentation about software development teams collaboration)
gitGraph:
options
{
    "nodeSpacing": 150,
    "nodeRadius": 10
}
end
commit
branch newbranch
checkout newbranch
commit
commit
checkout master
commit
commit
merge newbranch

GitGraph — Mermaid
PlantUML
PlantUML — allows to quickly “write” UML diagrams, Archimate diagrams, ERD-diagrams, С4-diagrams, Ditaa diagrams, Gantt diagrams, MinMap diagrams, WBS-diagrams, AsciiMath і JLaTeXMath notation.
Sample — ERD
@startuml

' hide the spot
hide circle

' avoid problems with angled crows feet
skinparam linetype ortho

entity "Entity01" as e01 {
  *e1_id : number <<generated>>
  --
  *name : text
  description : text
}

entity "Entity02" as e02 {
  *e2_id : number <<generated>>
  --
  *e1_id : number <<FK>>
  other_details : text
}

entity "Entity03" as e03 {
  *e3_id : number <<generated>>
  --
  e1_id : number <<FK>>
  other_details : text
}

e01 ||..o{ e02
e01 |o..o{ e03

@enduml
ERD diagram — PlantUML
Nomnoml
Nomnoml — one more tool to create UML diagrams from text.
Sample.
[<abstract>Marauder]<:--[Pirate]
[Pirate]- 0..7[mischief]
[jollyness]->[Pirate]
[jollyness]->[rum]
[jollyness]->[singing]
[Pirate]-> *[rum|tastiness: Int|swig()]
[Pirate]->[singing]
[singing]<->[rum]

[<start>st]->[<state>plunder]
[plunder]->[<choice>more loot]
[more loot]->[st]
[more loot] no ->[<end>e]

[<actor>Sailor] - [<usecase>shiver me;timbers]
UML Diagram — Nomnoml
BlockDiag
BlockDiag — simple diagram images generator, supports UML diagrams creation.
Sample.
blockdiag {
  blockdiag -> generates -> "block-diagrams";
  blockdiag -> is -> "very easy!";

  blockdiag [color = "#e84444"];
  "block-diagrams" [color = "#e9ecef"];
  "very easy!" [color = "gray"];
}
Blockdiag
WaveDrom
WaveDrom — draws your Timing Diagram or Waveform from simple textual description.
Sample.
{ signal: [
  { name: "clk",         wave: "p.....|..." },
  { name: "Data",        wave: "x.345x|=.x", data: ["head", "body", "tail", "data"] },
  { name: "Request",     wave: "0.1..0|1.0" },
  {},
  { name: "Acknowledge", wave: "1.....|01." }
]}

Wavedrom
GraphViz
GraphViz — open source graph visualization software.
Sample — Data Structures.
digraph g {
    graph [
        rankdir = "LR"
    ];
    node [
        fontsize = "16"
        shape = "ellipse"
    ];
    edge [
    ];

    "node0" [
        label = "<f0> 0x10ba8| <f1>"
        shape = "record"
    ];
    "node1" [
        label = "<f0> 0xf7fc4380| <f1> | <f2> |-1"
        shape = "record"
    ];
    "node2" [
        label = "<f0> 0xf7fc44b8| | |2"
        shape = "record"
    ];
    "node3" [
        label = "<f0> 3.43322790286038071e-06|44.79998779296875|0"
        shape = "record"
    ];
    "node4" [
        label = "<f0> 0xf7fc4380| <f1> | <f2> |2"
        shape = "record"
    ];
    "node5" [
        label = "<f0> (nil)| | |-1"
        shape = "record"
    ];
    "node6" [
        label = "<f0> 0xf7fc4380| <f1> | <f2> |1"
        shape = "record"
    ];
    "node7" [
        label = "<f0> 0xf7fc4380| <f1> | <f2> |2"
        shape = "record"
    ];
    "node8" [
        label = "<f0> (nil)| | |-1"
        shape = "record"
    ];
    "node9" [
        label = "<f0> (nil)| | |-1"
        shape = "record"
    ];
    "node10" [
        label = "<f0> (nil)| <f1> | <f2> |-1"
        shape = "record"
    ];
    "node11" [
        label = "<f0> (nil)| <f1> | <f2> |-1"
        shape = "record"
    ];
    "node12" [
        label = "<f0> 0xf7fc43e0| | |1"
        shape = "record"
    ];
    "node0":f0 -> "node1":f0 [
        id = 0
    ];
    "node0":f1 -> "node2":f0 [
        id = 1
    ];
    "node1":f0 -> "node3":f0 [
        id = 2
    ];
    "node1":f1 -> "node4":f0 [
        id = 3
    ];
    "node1":f2 -> "node5":f0 [
        id = 4
    ];
    "node4":f0 -> "node3":f0 [
        id = 5
    ];
    "node4":f1 -> "node6":f0 [
        id = 6
    ];
    "node4":f2 -> "node10":f0 [
        id = 7
    ];
    "node6":f0 -> "node3":f0 [
        id = 8
    ];
    "node6":f1 -> "node7":f0 [
        id = 9
    ];
    "node6":f2 -> "node9":f0 [
        id = 10
    ];
    "node7":f0 -> "node3":f0 [
        id = 11
    ];
    "node7":f1 -> "node1":f0 [
        id = 12
    ];
    "node7":f2 -> "node8":f0 [
        id = 13
    ];
    "node10":f1 -> "node11":f0 [
        id = 14
    ];
    "node10":f2 -> "node12":f0 [
        id = 15
    ];
    "node11":f2 -> "node1":f0 [
        id = 16
    ];
}
Data Structures — GraphViz
There are many other similar tools. I mentioned here only those ones I really use and can recommend.
I 🖤 (Mermaid, GraphViz <3 Azure DevOps)
My scenarios for using diagram generators are as follows:
A simple scenario – is a manual “writing” of diagrams, using the semantics of a tool. Most of all, I prefer Mermaid. I can create a visualization directly on the wiki page in Azure DevOps, instead of inserting a ready-made PNG or SVG image, after converting the “raw” diagram file.
Complex scenario – auto-documentation. I have solutions and products for which the documentation includes many different diagrams. Without revealing the details, I will give an abstract example. Suppose a solution architecture involves the use of Enterprise Service Bus for data exchange between several business systems. All the logic of system integration is implemented in the so-called integration packages, which essentially perform ETL operations on business data. The documentation is built automatically during the continuous delivery phase of each new version of the product. The following technologies are used:
Azure DevOps Pipelines (continuous integration & continuous delivery);
GraphViz for building the diagrams from XML-based data integration packages;
documentation is built by a library written in PowerShell (internal development), it also interacts with GraphViz.
Thus, using the tools for diagrams generating mentioned above (and similar ones) made it possible:
Significantly reduce the efforts on “manual” creation and maintenance of diagrams that reflect the structure and behavior of individual components.
Generate documentation in a fully automatic mode, without human cost.
Diagrams as code – is a way to get all the benefits of using version control systems while creating and maintaining architectural diagrams. To evaluate the effect, just imagine that your team missed the opportunity to use Git during development.
Kroki.io – A Unified API For Working With Architectural Diagram Generators
It would seem that this could be the end, if not for one moment. The variety of tools is, of course, a big deal. However, each of them requires some routine setup actions, such as installation, upgrade, configuration. And each of them brings its dependencies, according to the used technology stack: Ruby on Rails, Python, Java,…. As a result, I discovered for myself a hidden gem – Kroki.io. It is a tool that simply provides a unified API for interacting with BlockDiag (BlockDiag, SeqDiag, ActDiag, NwDiag, PacketDiag, RackDiag), BPMN, Bytefield, C4 (via PlantUML), Ditaa, Erd, GraphViz , Mermaid, Nomnoml, PlantUML, SvgBob, UMLet, Vega, Vega-Lite, WaveDrom … And much more is ahead!
A Few Words About Kroki.io
supports a vast number of tools for creating diagrams, graphs, charts, other visualizations from the text;
free;
open-source;
supports export to PNG, SVG, JPEG, PDF, BASE64;
available as a service (you do not need to do anything before start using it). But it is not production-ready, only as a demo version;
also available as self-hosted - you can install and configure for yourself. That’s what I did. All you need is Docker, Docker Compose. The installation and setup process takes a few minutes.
4 Steps To Starting Using Kroki.io
Install Docker. To check the installed version, run the following command in the terminal:
docker —versionLaunch the kroki container. At once I give the command with all parameters to start the container in detached mode, and to map your local port 8080 on port 8000 in the container. Execute the command in the terminal
docker run -p8080:8000 -d yuzutech/krokiDone. To check, run ‘/path/to/kroki version’ in termial. If the installation is successful, you will see the Kroki CLI version.
The command interface for interaction with Kroki looks like this:
/path/to/kroki <command> [options] <arguments>
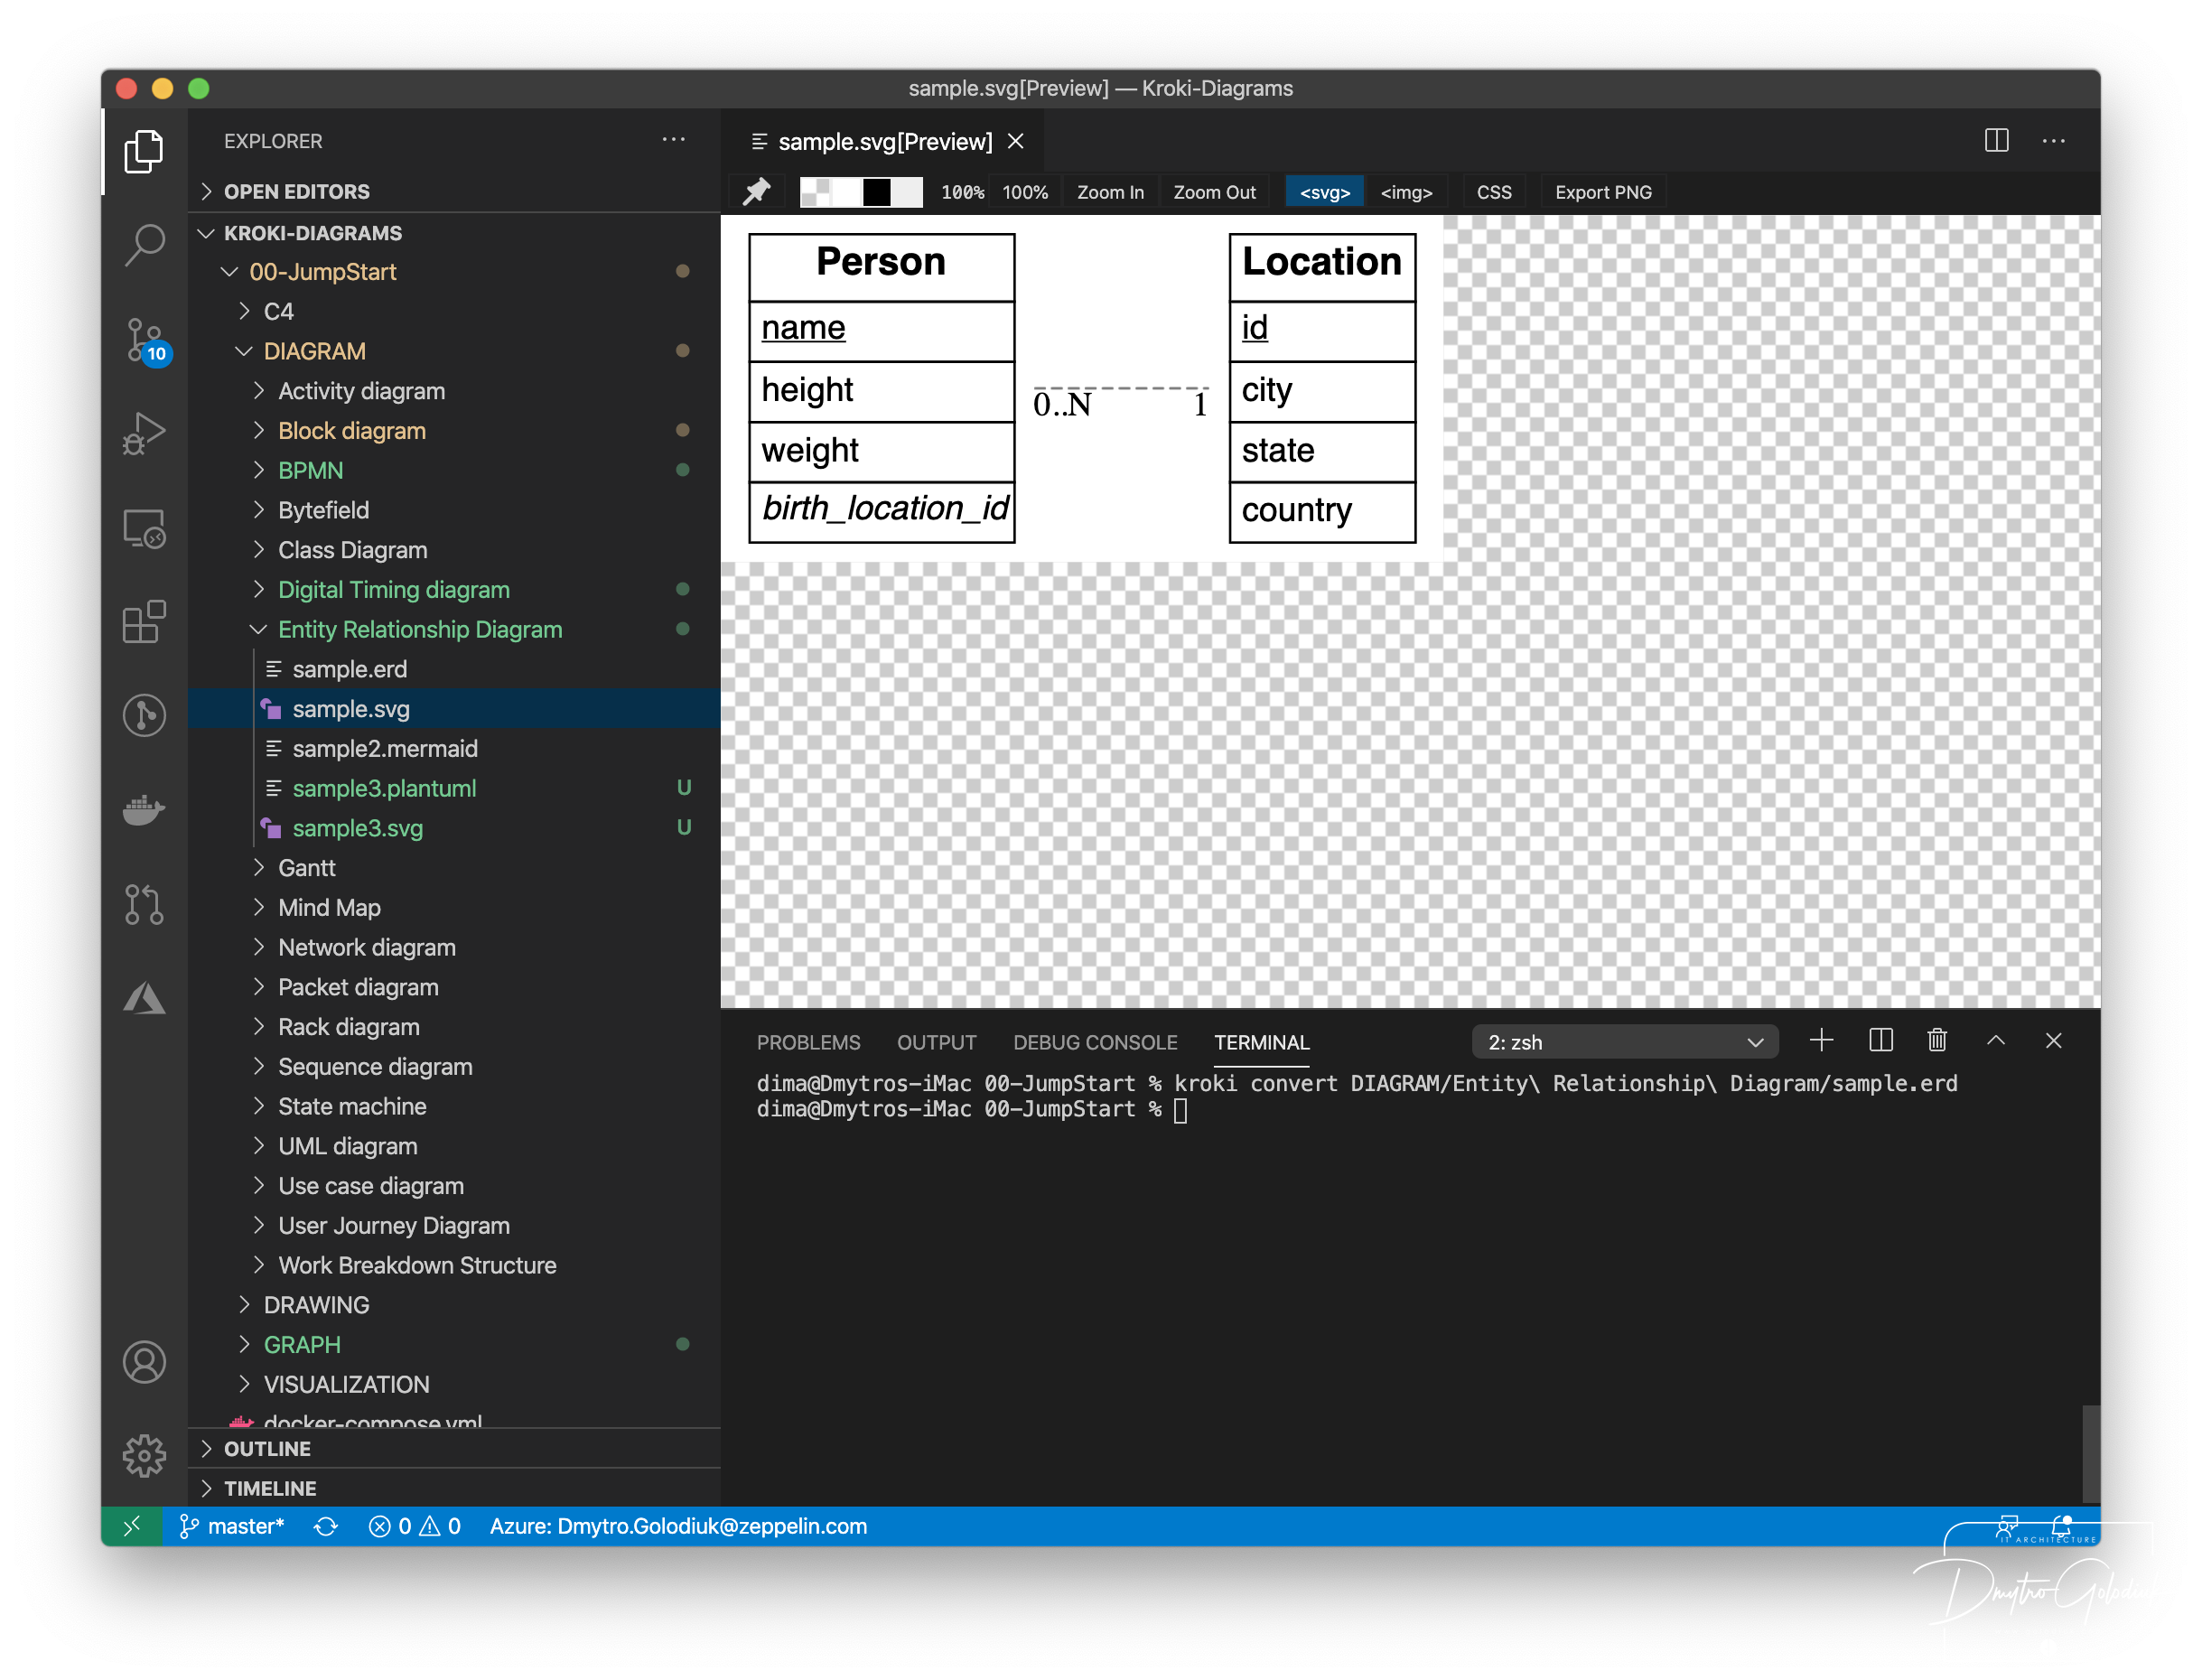
Let’s Move On To Practice
And this is how the work looks in practice.
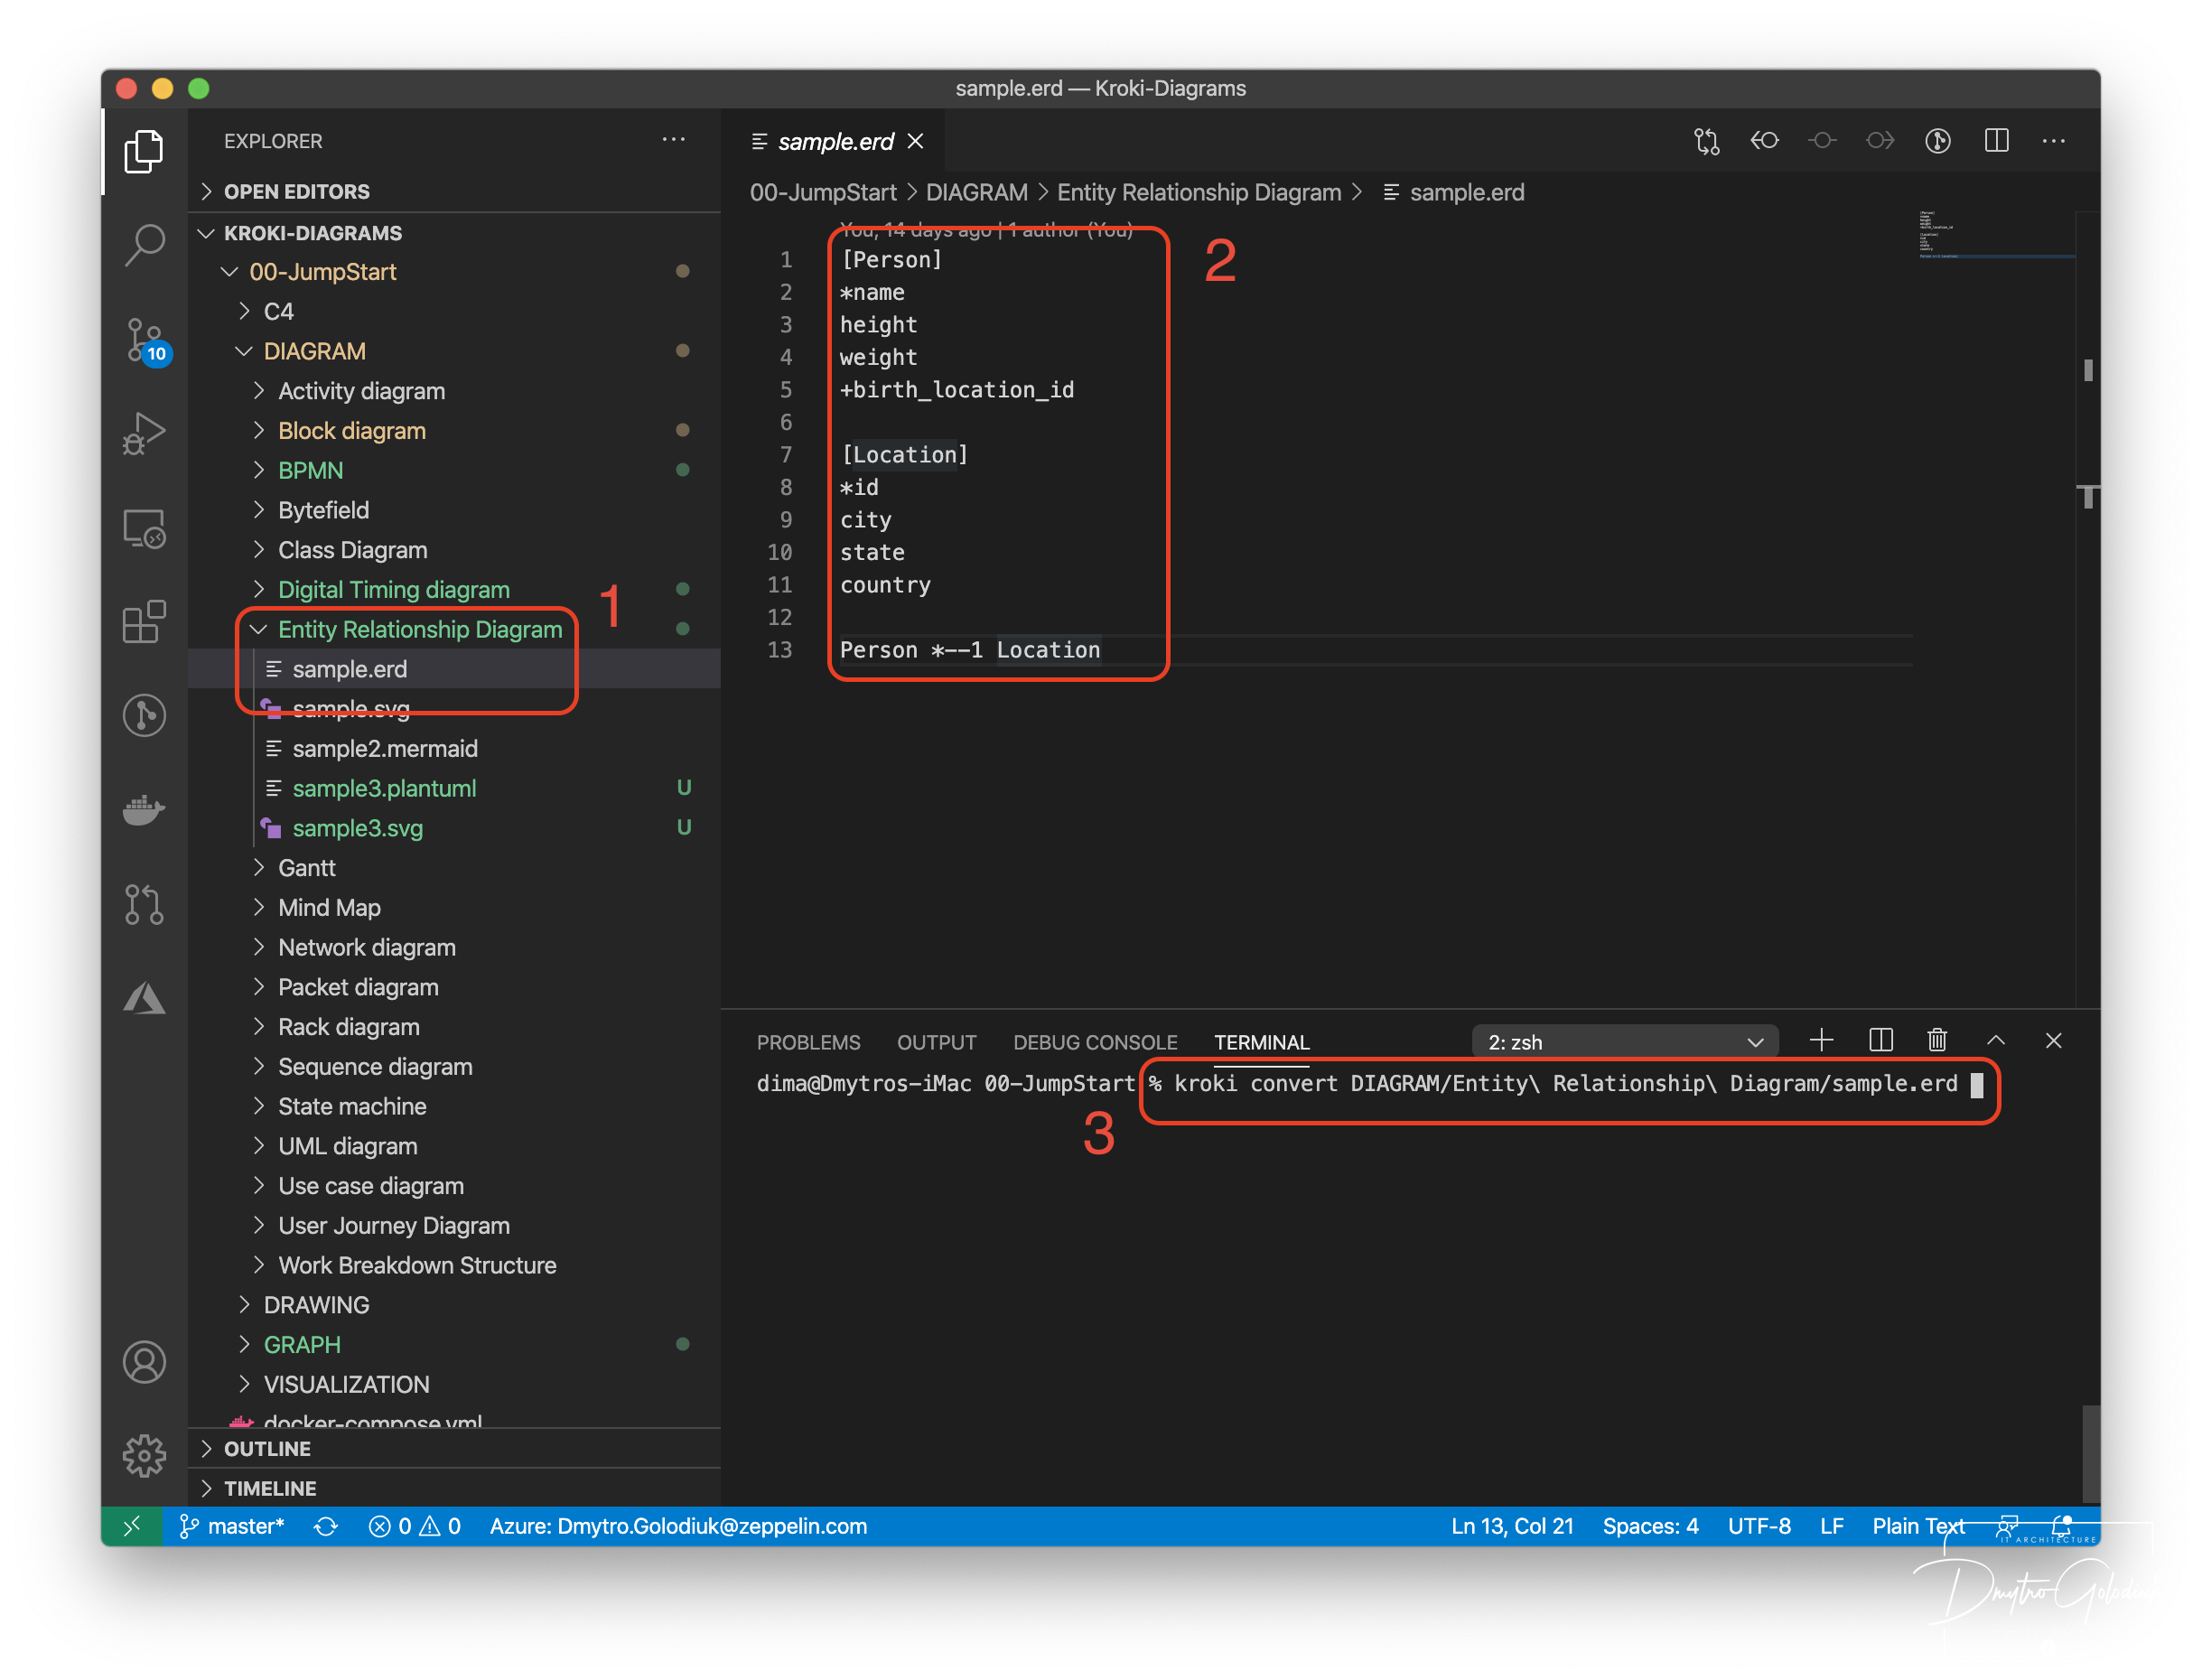
Docker image yuzutech/kroki allows you to work not with the whole set of available diagrams, only with the following:
/c4plantuml
/ditaa
/erd
/graphviz
/dot
/nomnoml
/plantuml
/svgbob
/umlet
/vega
/vegalite
In order to use BlockDiag, ActDiag, NwDiag, SeqDiag, Mermaid or BPMN you have to run additional set of containers: yuzutech/kroki-blockdiag, yuzutech/kroki-mermaid, yuzutech/kroki-bpmn
To simplify the process you can use docker-compose up -d to run few containers at once, using the already prepared file docker-compose.yml with the appropriate instructions.
You will find all references to the documentation at the end of the article ⬇.
I have prepared a repository on GitHub, where you can find more than a dozen examples of different types of charts, their description in various notations, their graphical representation. The link is also at the end of the article.
Summing Up
Keep on developing your IT solutions by using just enough architectural documentation, diagrams. Don’t create them for any other reasons, especially if the team doesn’t need them.
“Manual” creation and maintenance of diagrams that reflect the structure and behavior of individual components in most cases is not an optimal approach and is a waste of time. Generate diagrams from code you already have in your repositories.
Instead of creating an excessive number of diagrams, focus on two or three ones that comprehensively describe the product from different levels of abstraction and are really necessary.
Always keep diagrams updated. This task is made more accessible if it doesn’t contain too many details – just prefer abstractions.
Educate the internal culture of the team to understand the need for architectural documents, including diagrams.
Never create architectural diagrams just “to be” to justify your role as an architect.
Try kroki.io - I like it.
Useful Links
Book “Documenting Software Architectures: Views and Beyond, Second Edition.”
My overview of IT Architect role.
Mermaid, PlantUML, UMLlet, Nomnoml, BlockDiag, WaveDrom, GraphViz, — tools I mentioned in this article to generate architectural diagrams from the text.
Kroki.io — API for interacting with BlockDiag (BlockDiag, SeqDiag, ActDiag, NwDiag, PacketDiag, RackDiag), BPMN, Bytefield, C4 (using PlantUML), Ditaa, Erd, GraphViz, Mermaid, Nomnoml, PlantUML, SvgBob, UMLet, Vega, Vega-Lite, WaveDrom…
How to use Kroki.io — user manual.
Installation guide for kroki.io.
My GitHub repository with samples.

Thank you!